第一步:下载xdebug
先根据php版本去下载一个对应的php_xdebug.dll
1 | https://xdebug.org/wizard |
第二步:在php.ini中配置xdebug
在php.ini中添加
1 | [Xdebug] |
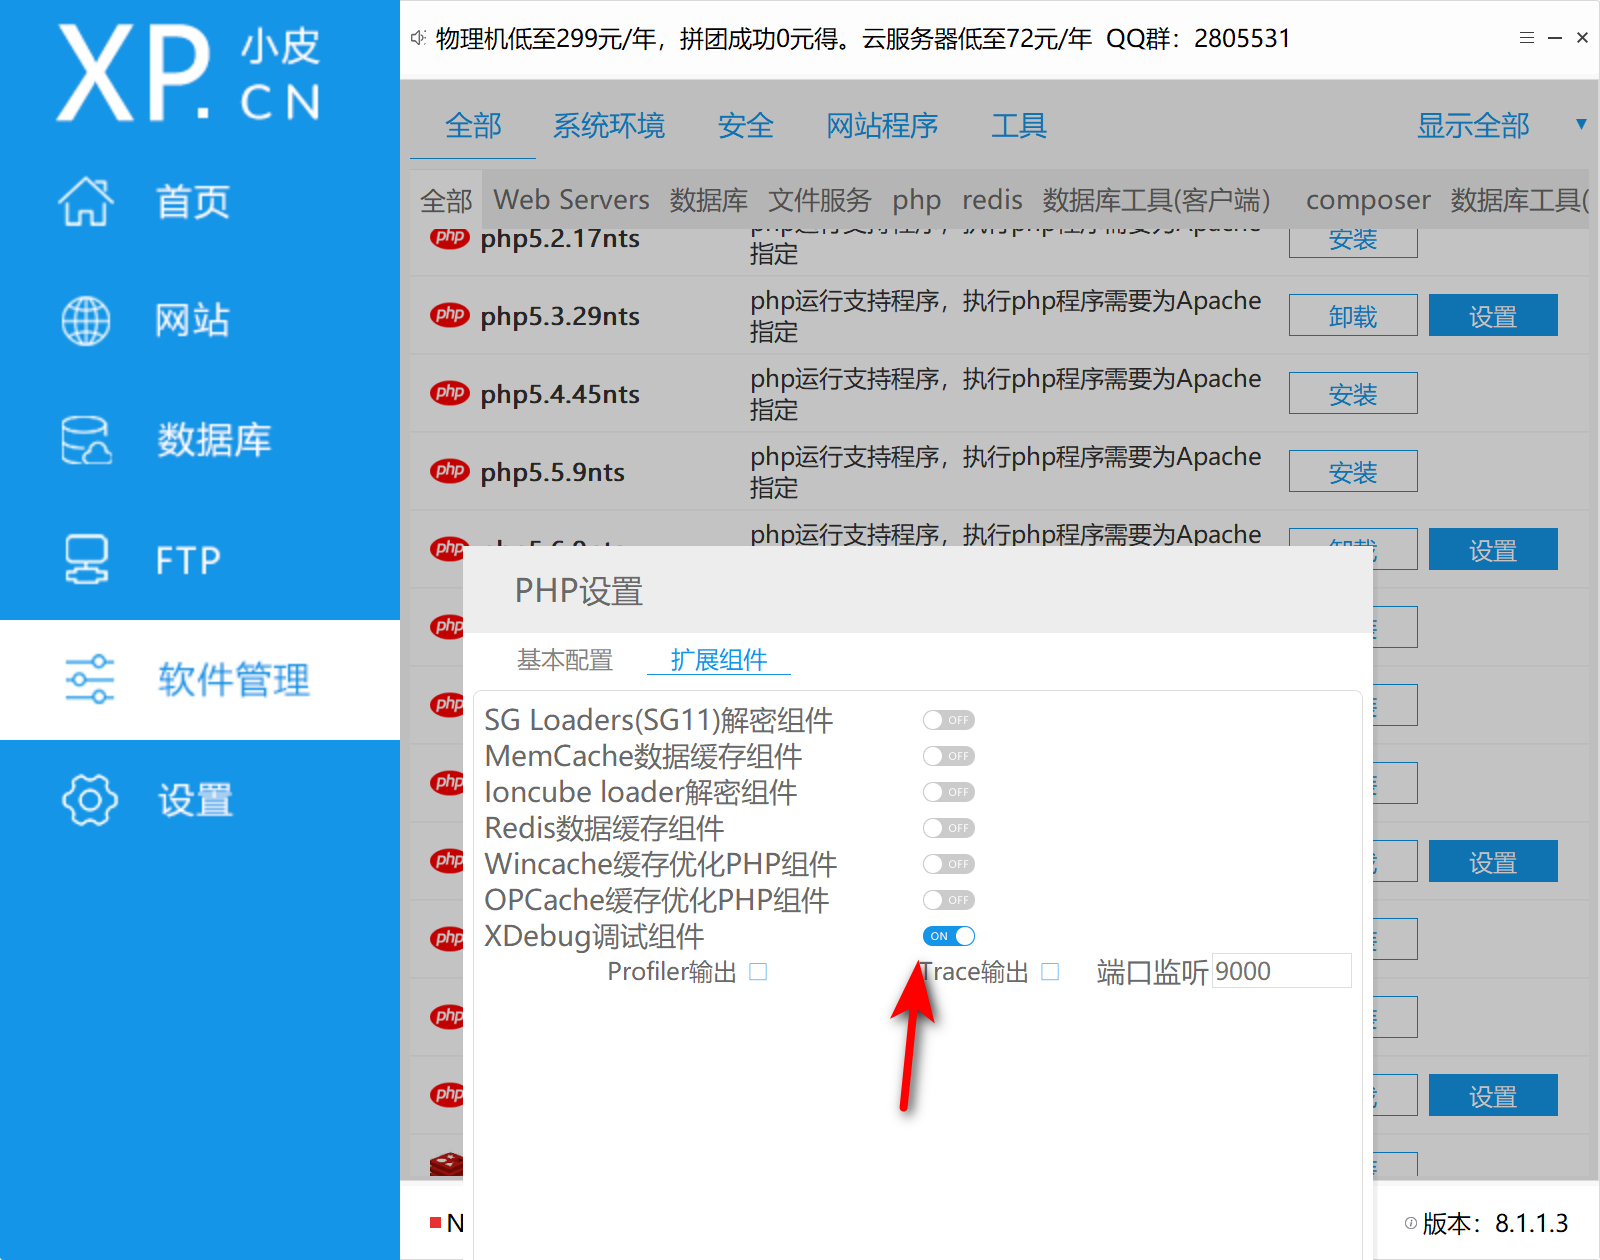
使用phpstudy,可以将前两步代替掉
 |
|---|
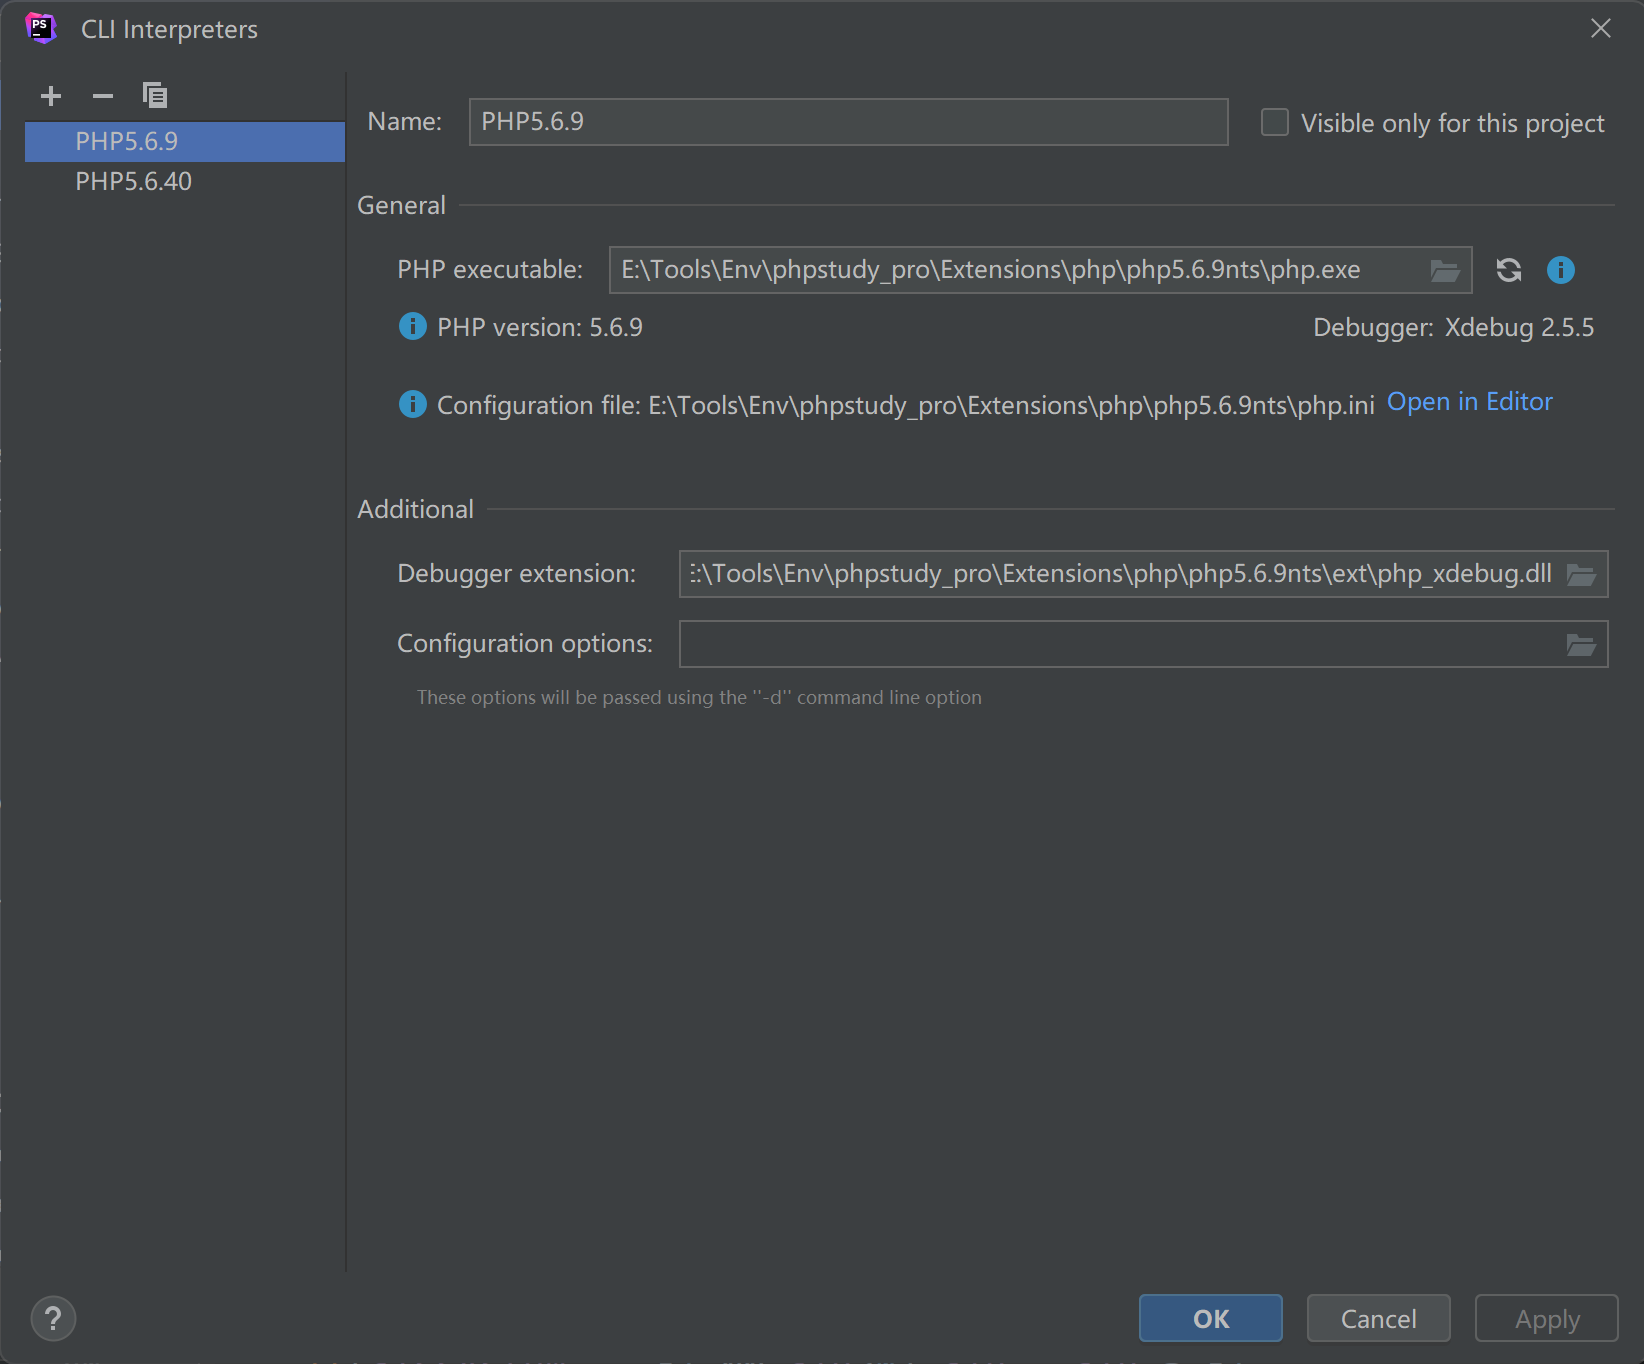
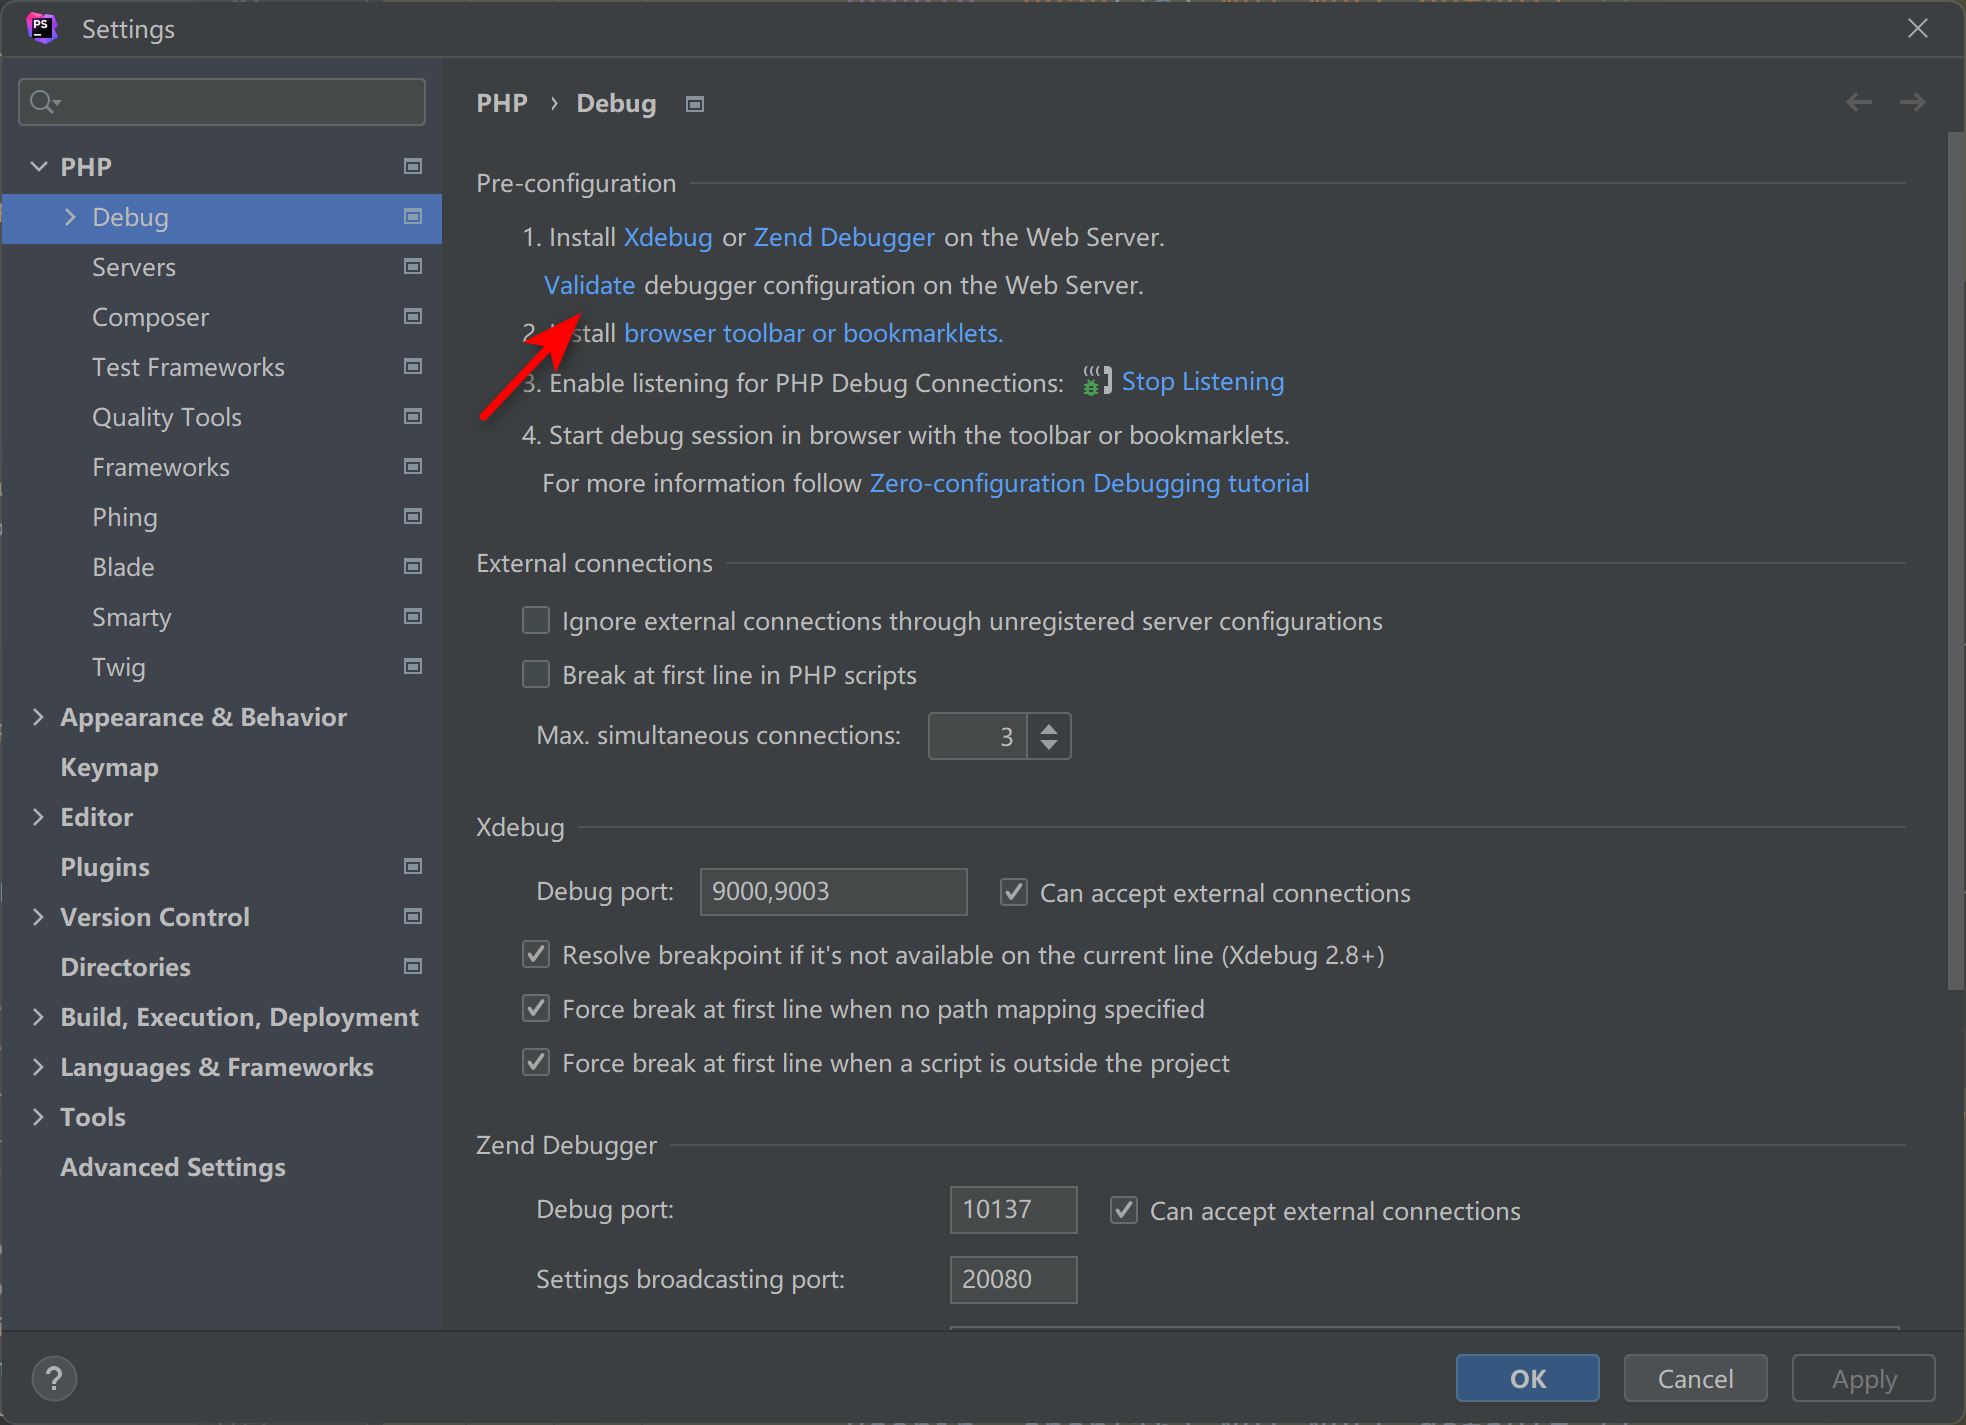
第三步:在phpstorm配置php和xdebug
然后在 phpstorm中,添加一个php的环境和xdebug扩展
 |
|---|
在
 |
|---|
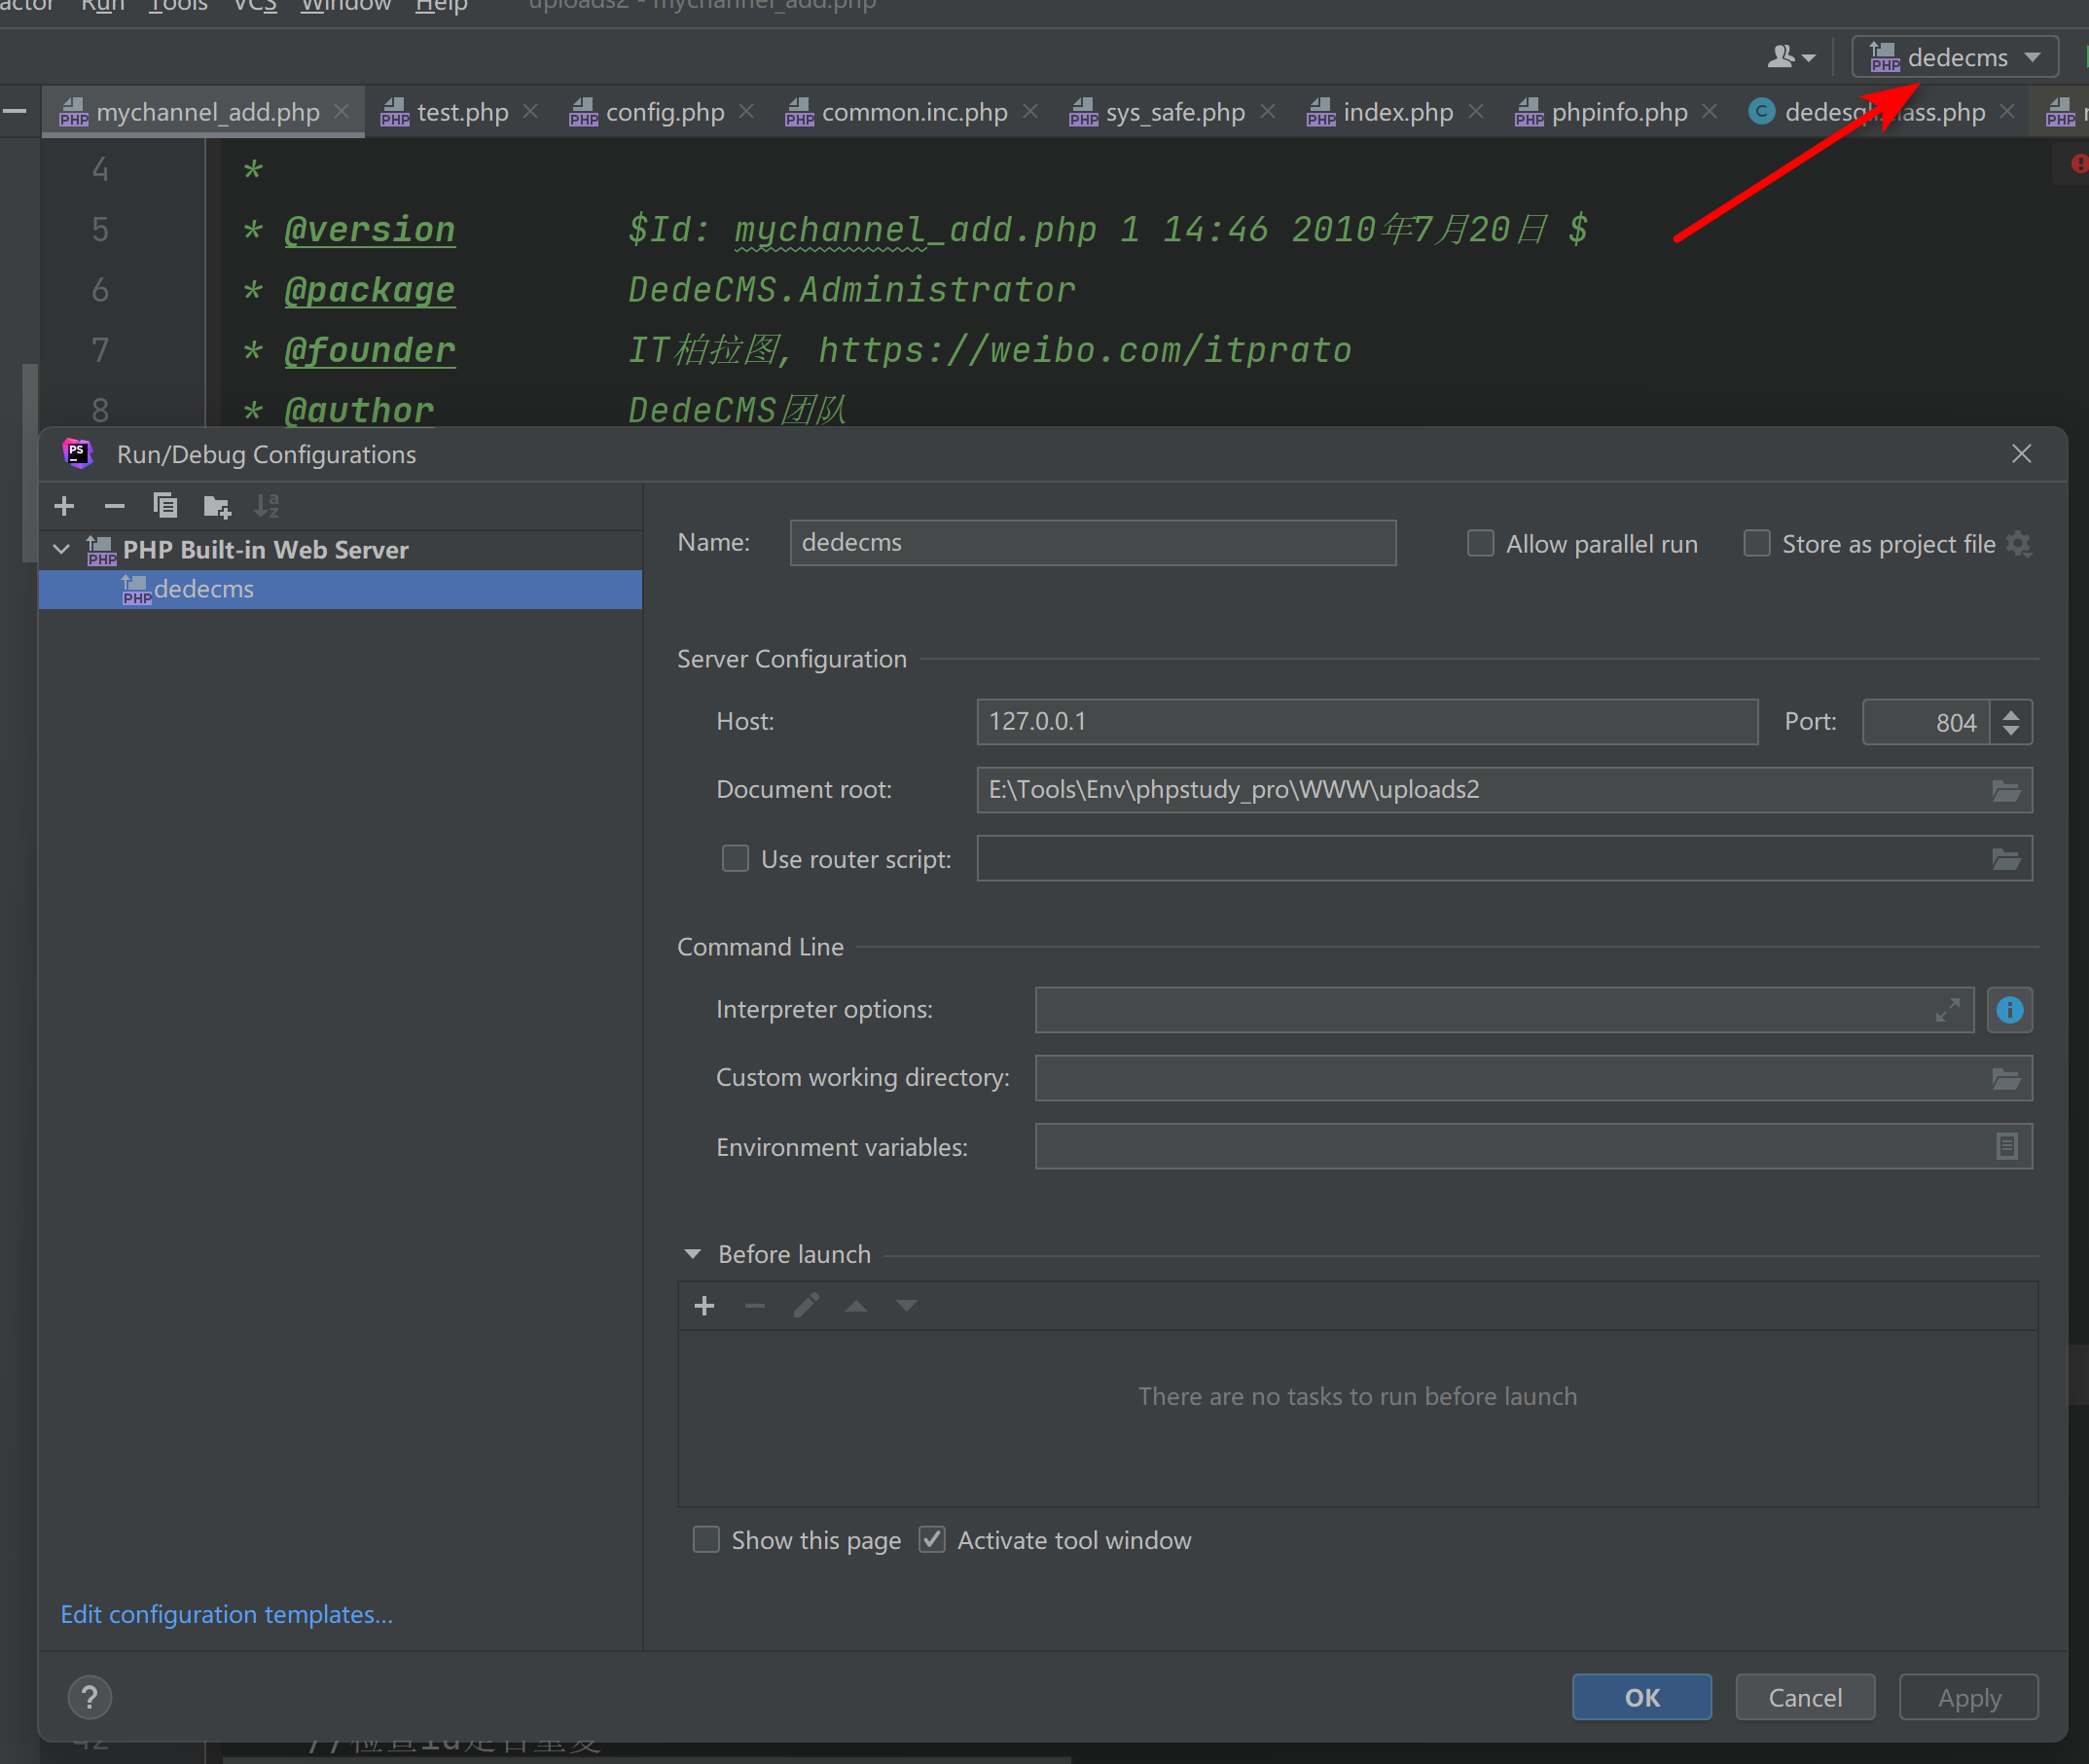
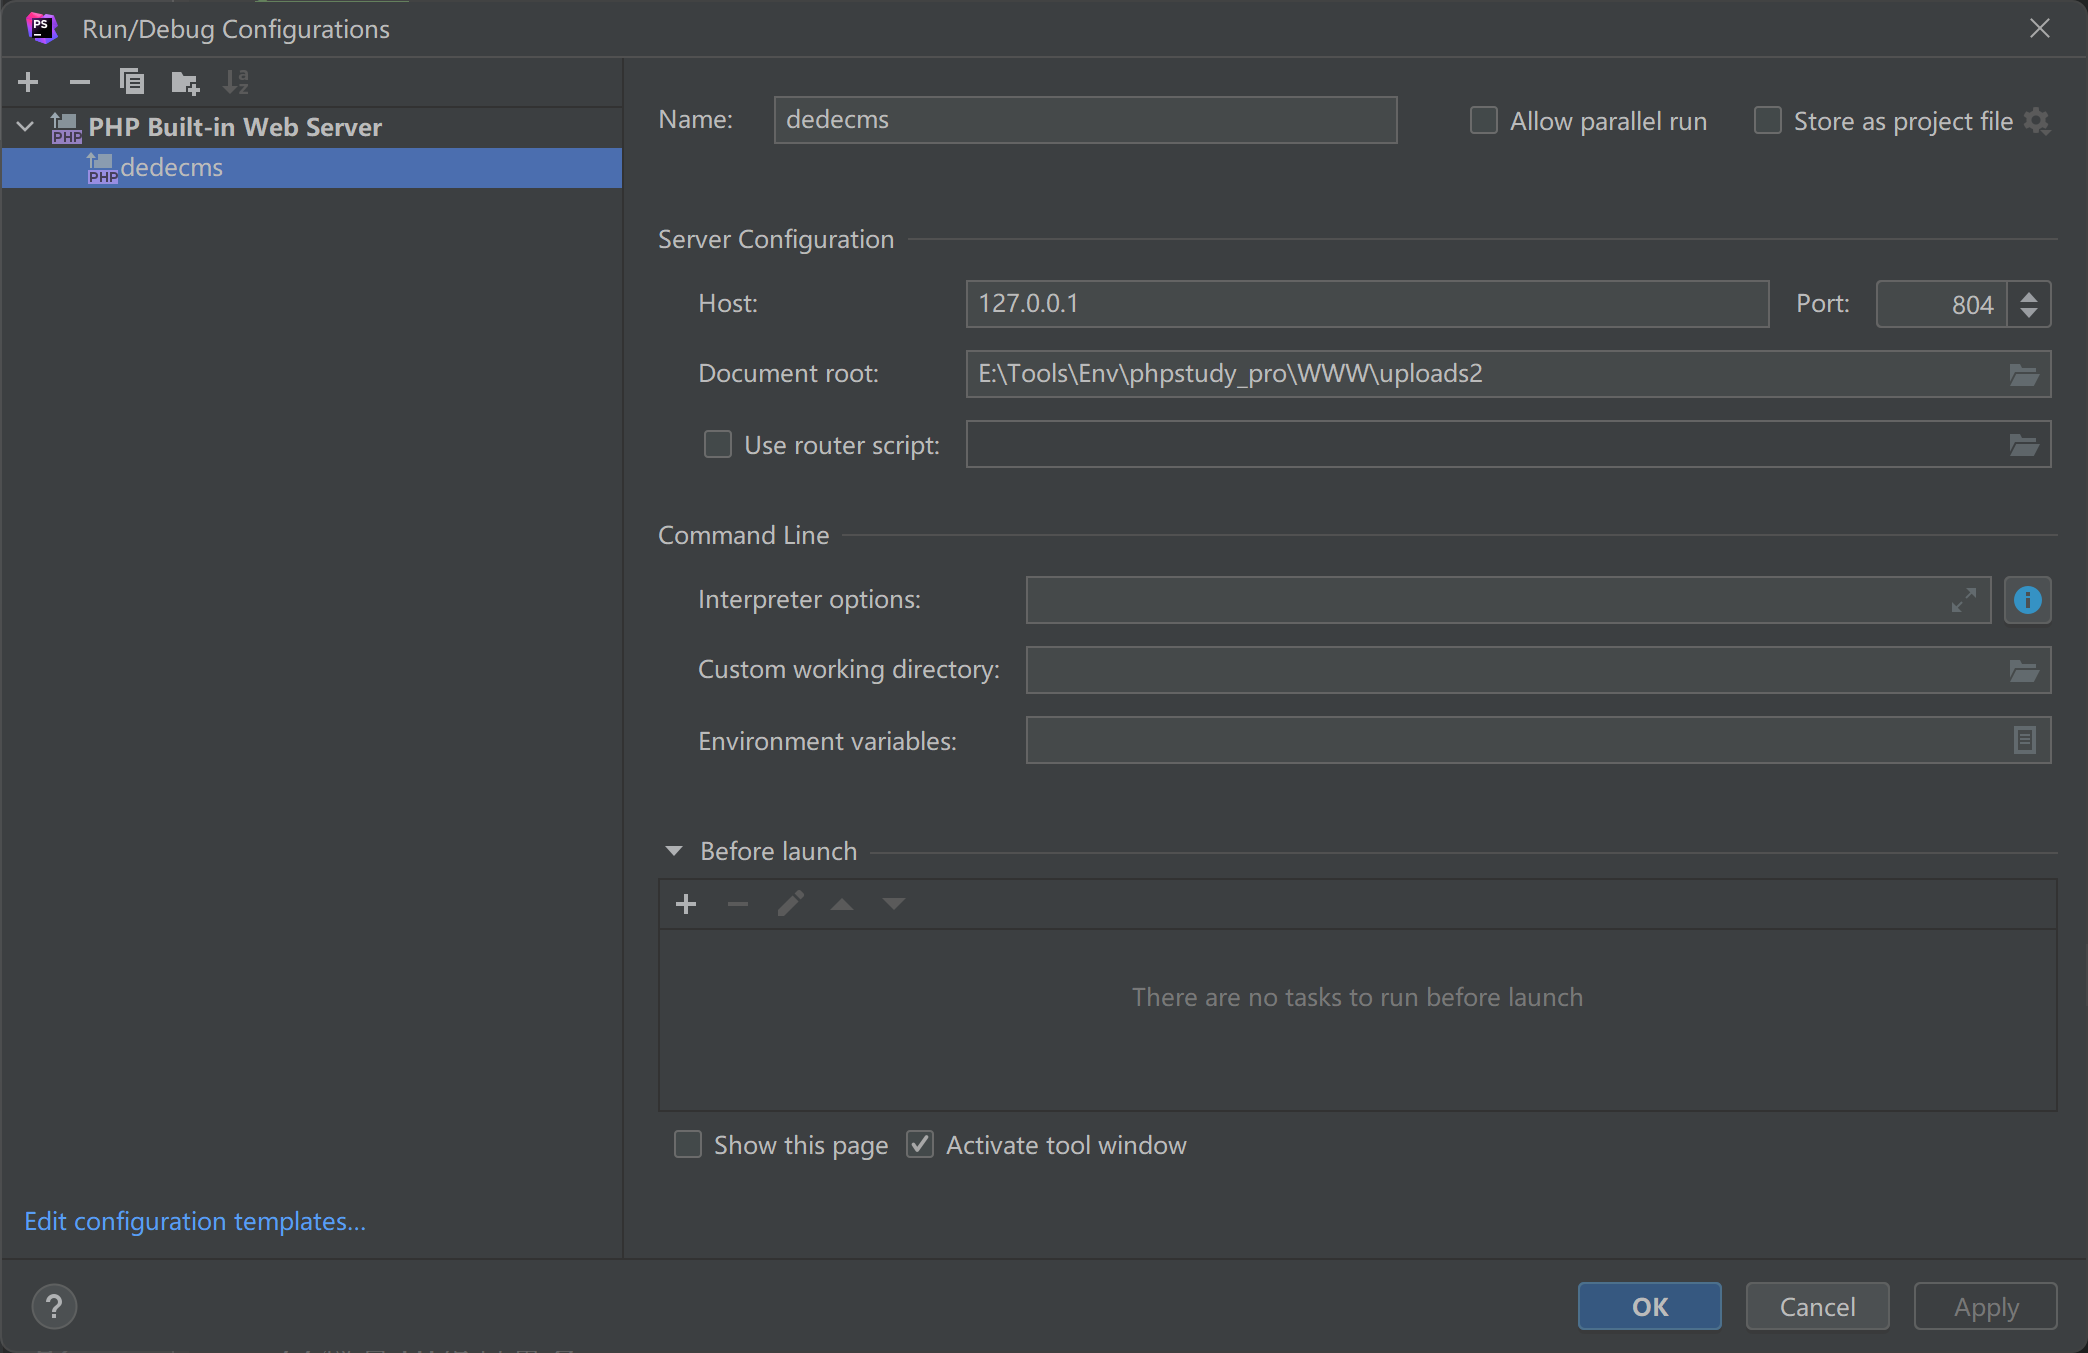
添加一个PHP Built-in Web Server, 配置好 Server Configuration
 |
|---|
运行,然后先访问一下 127.0.0.1:804
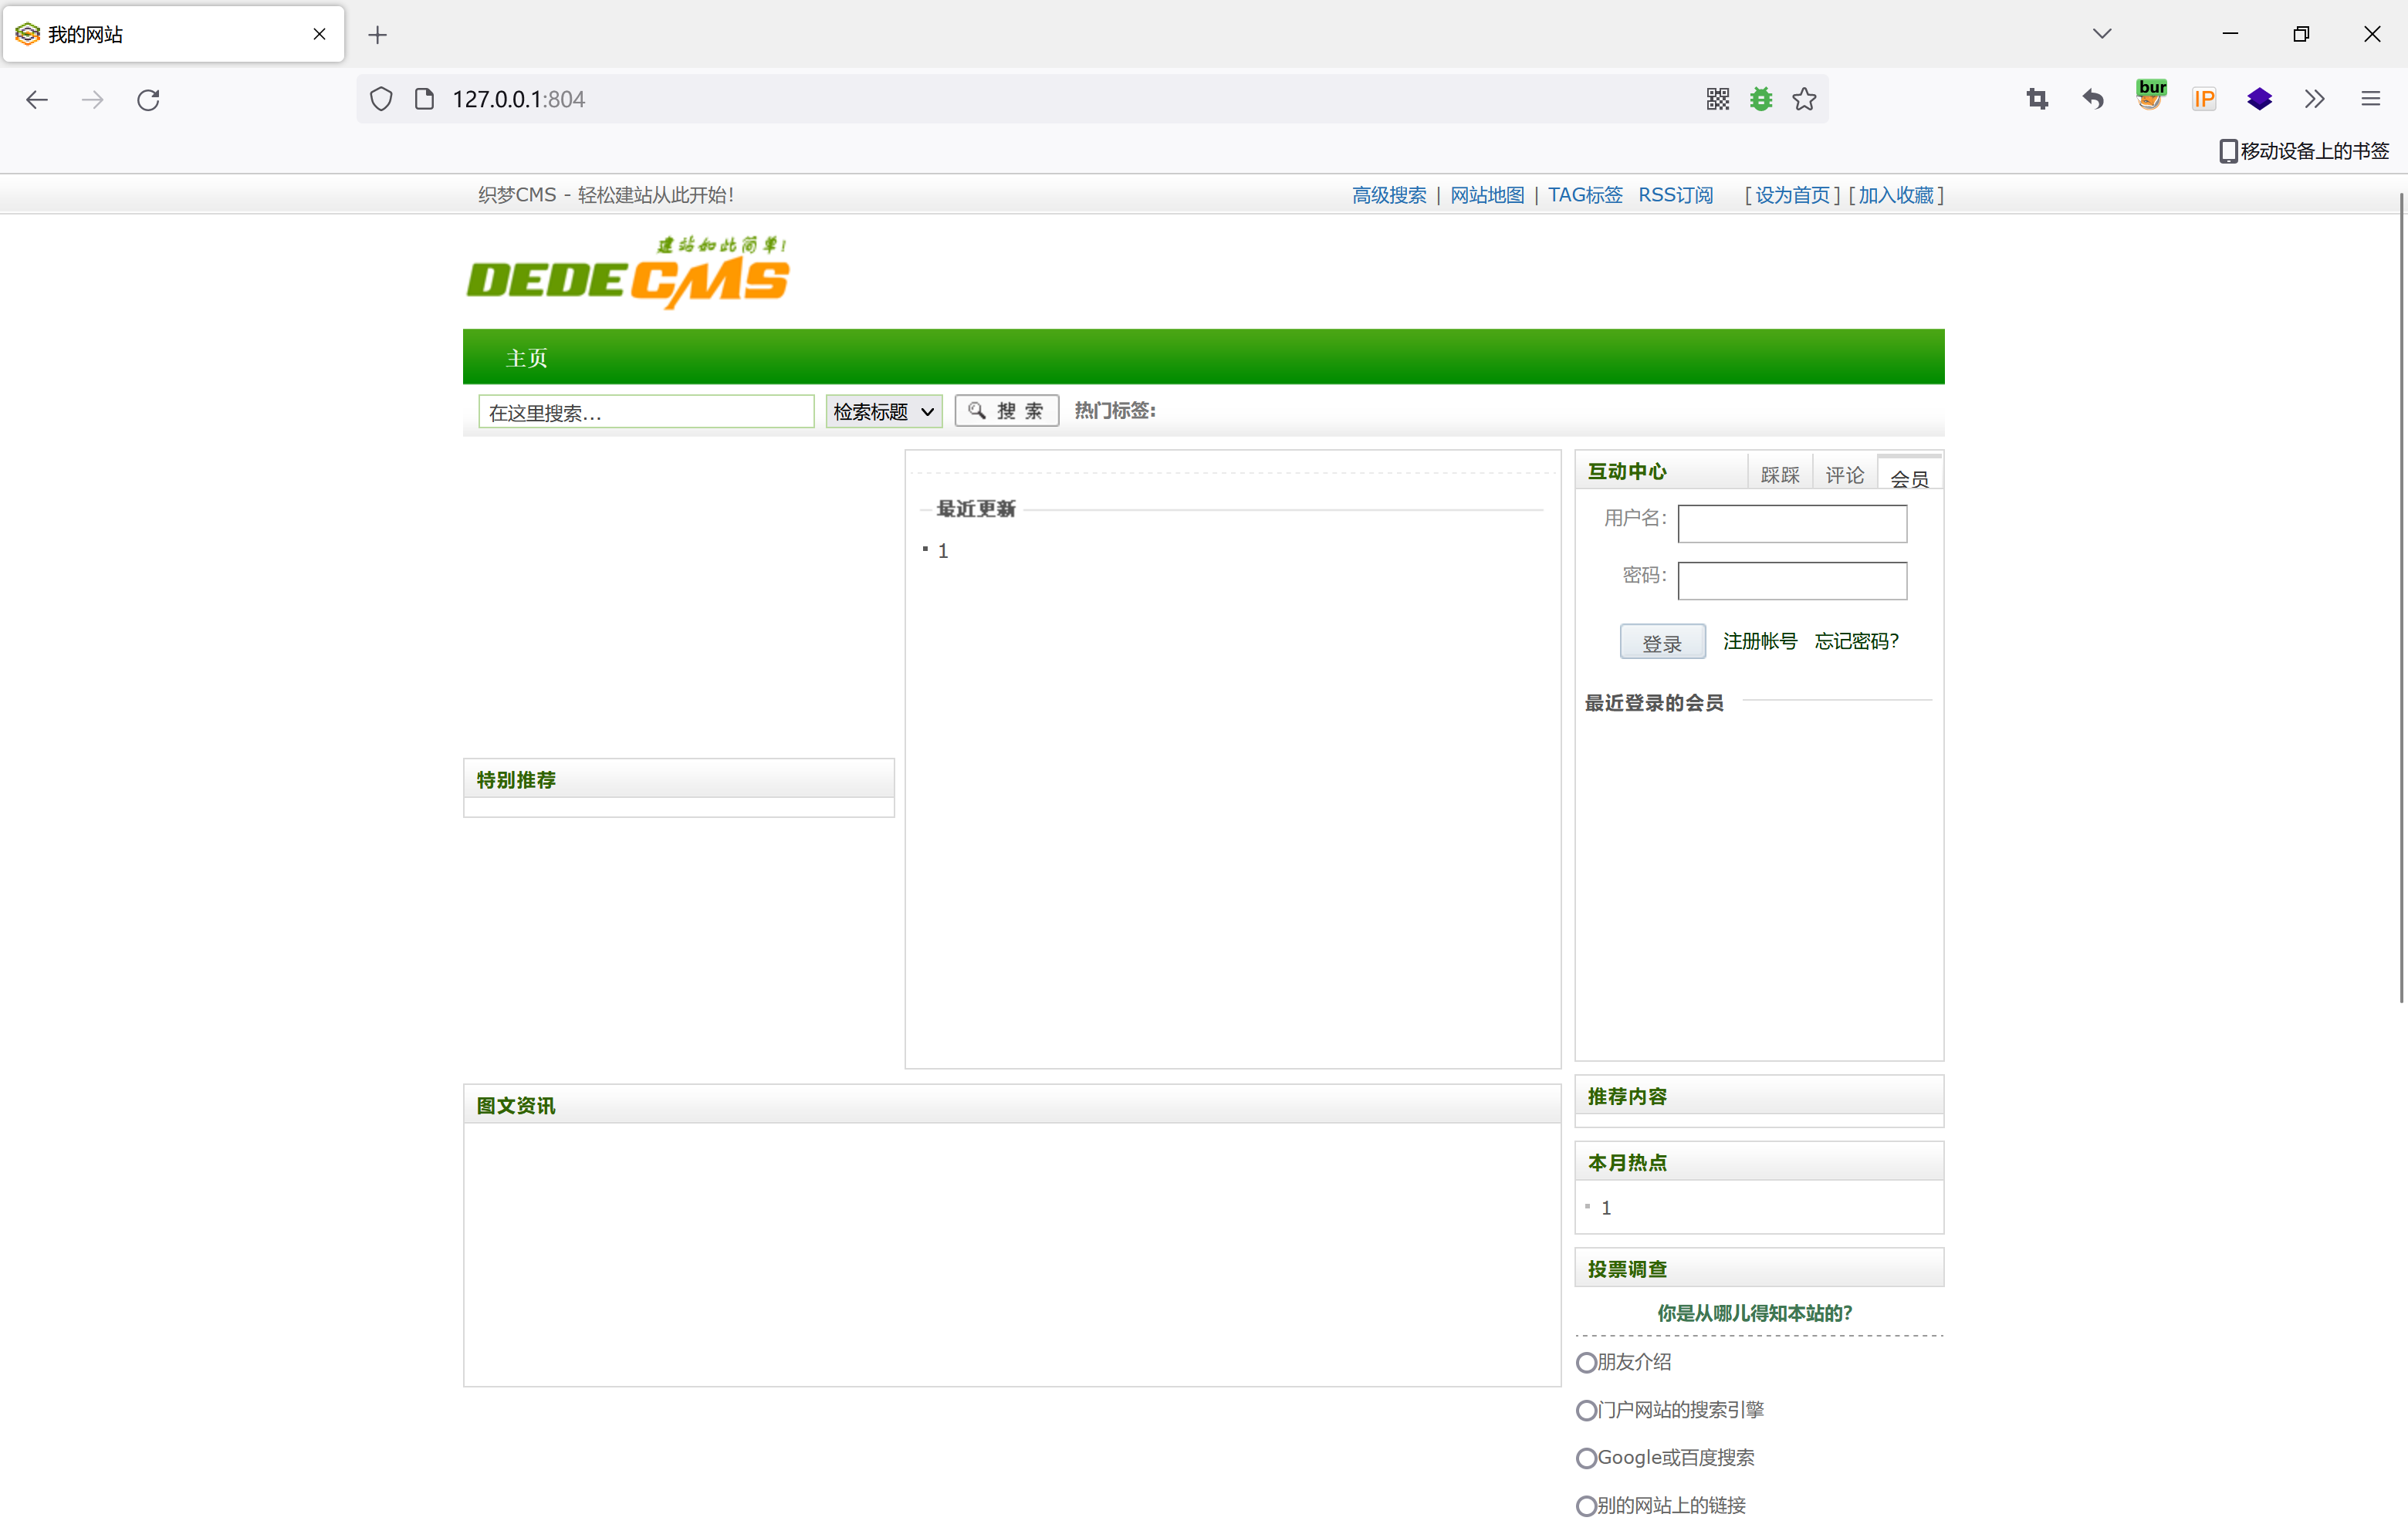 |
|---|
然后回到 phpstorm 中验证一下
 |
|---|
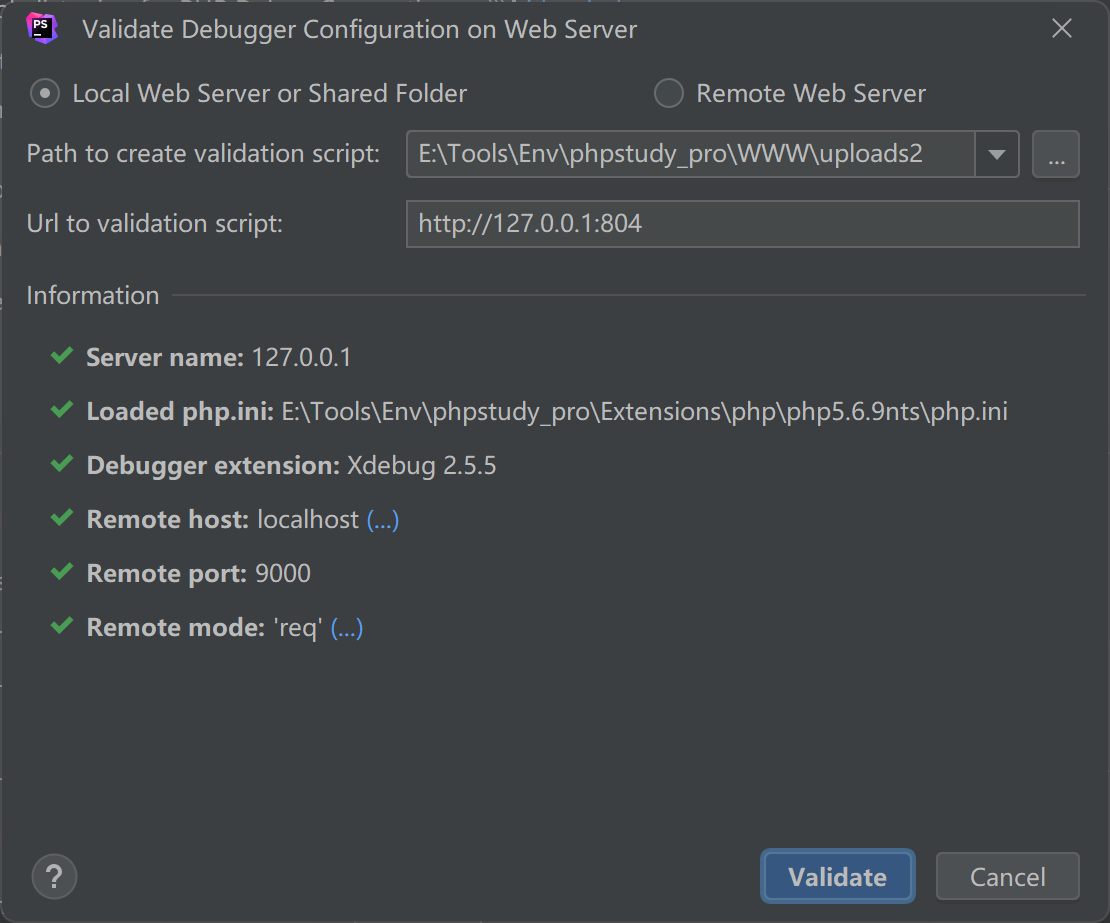 |
|---|
这样表示成功
第四步:在火狐中安装xdebug扩展,并测试
接下来 在浏览器中安装 一个扩展
1 | https://www.jetbrains.com/help/phpstorm/2021.1/browser-debugging-extensions.html |
启用
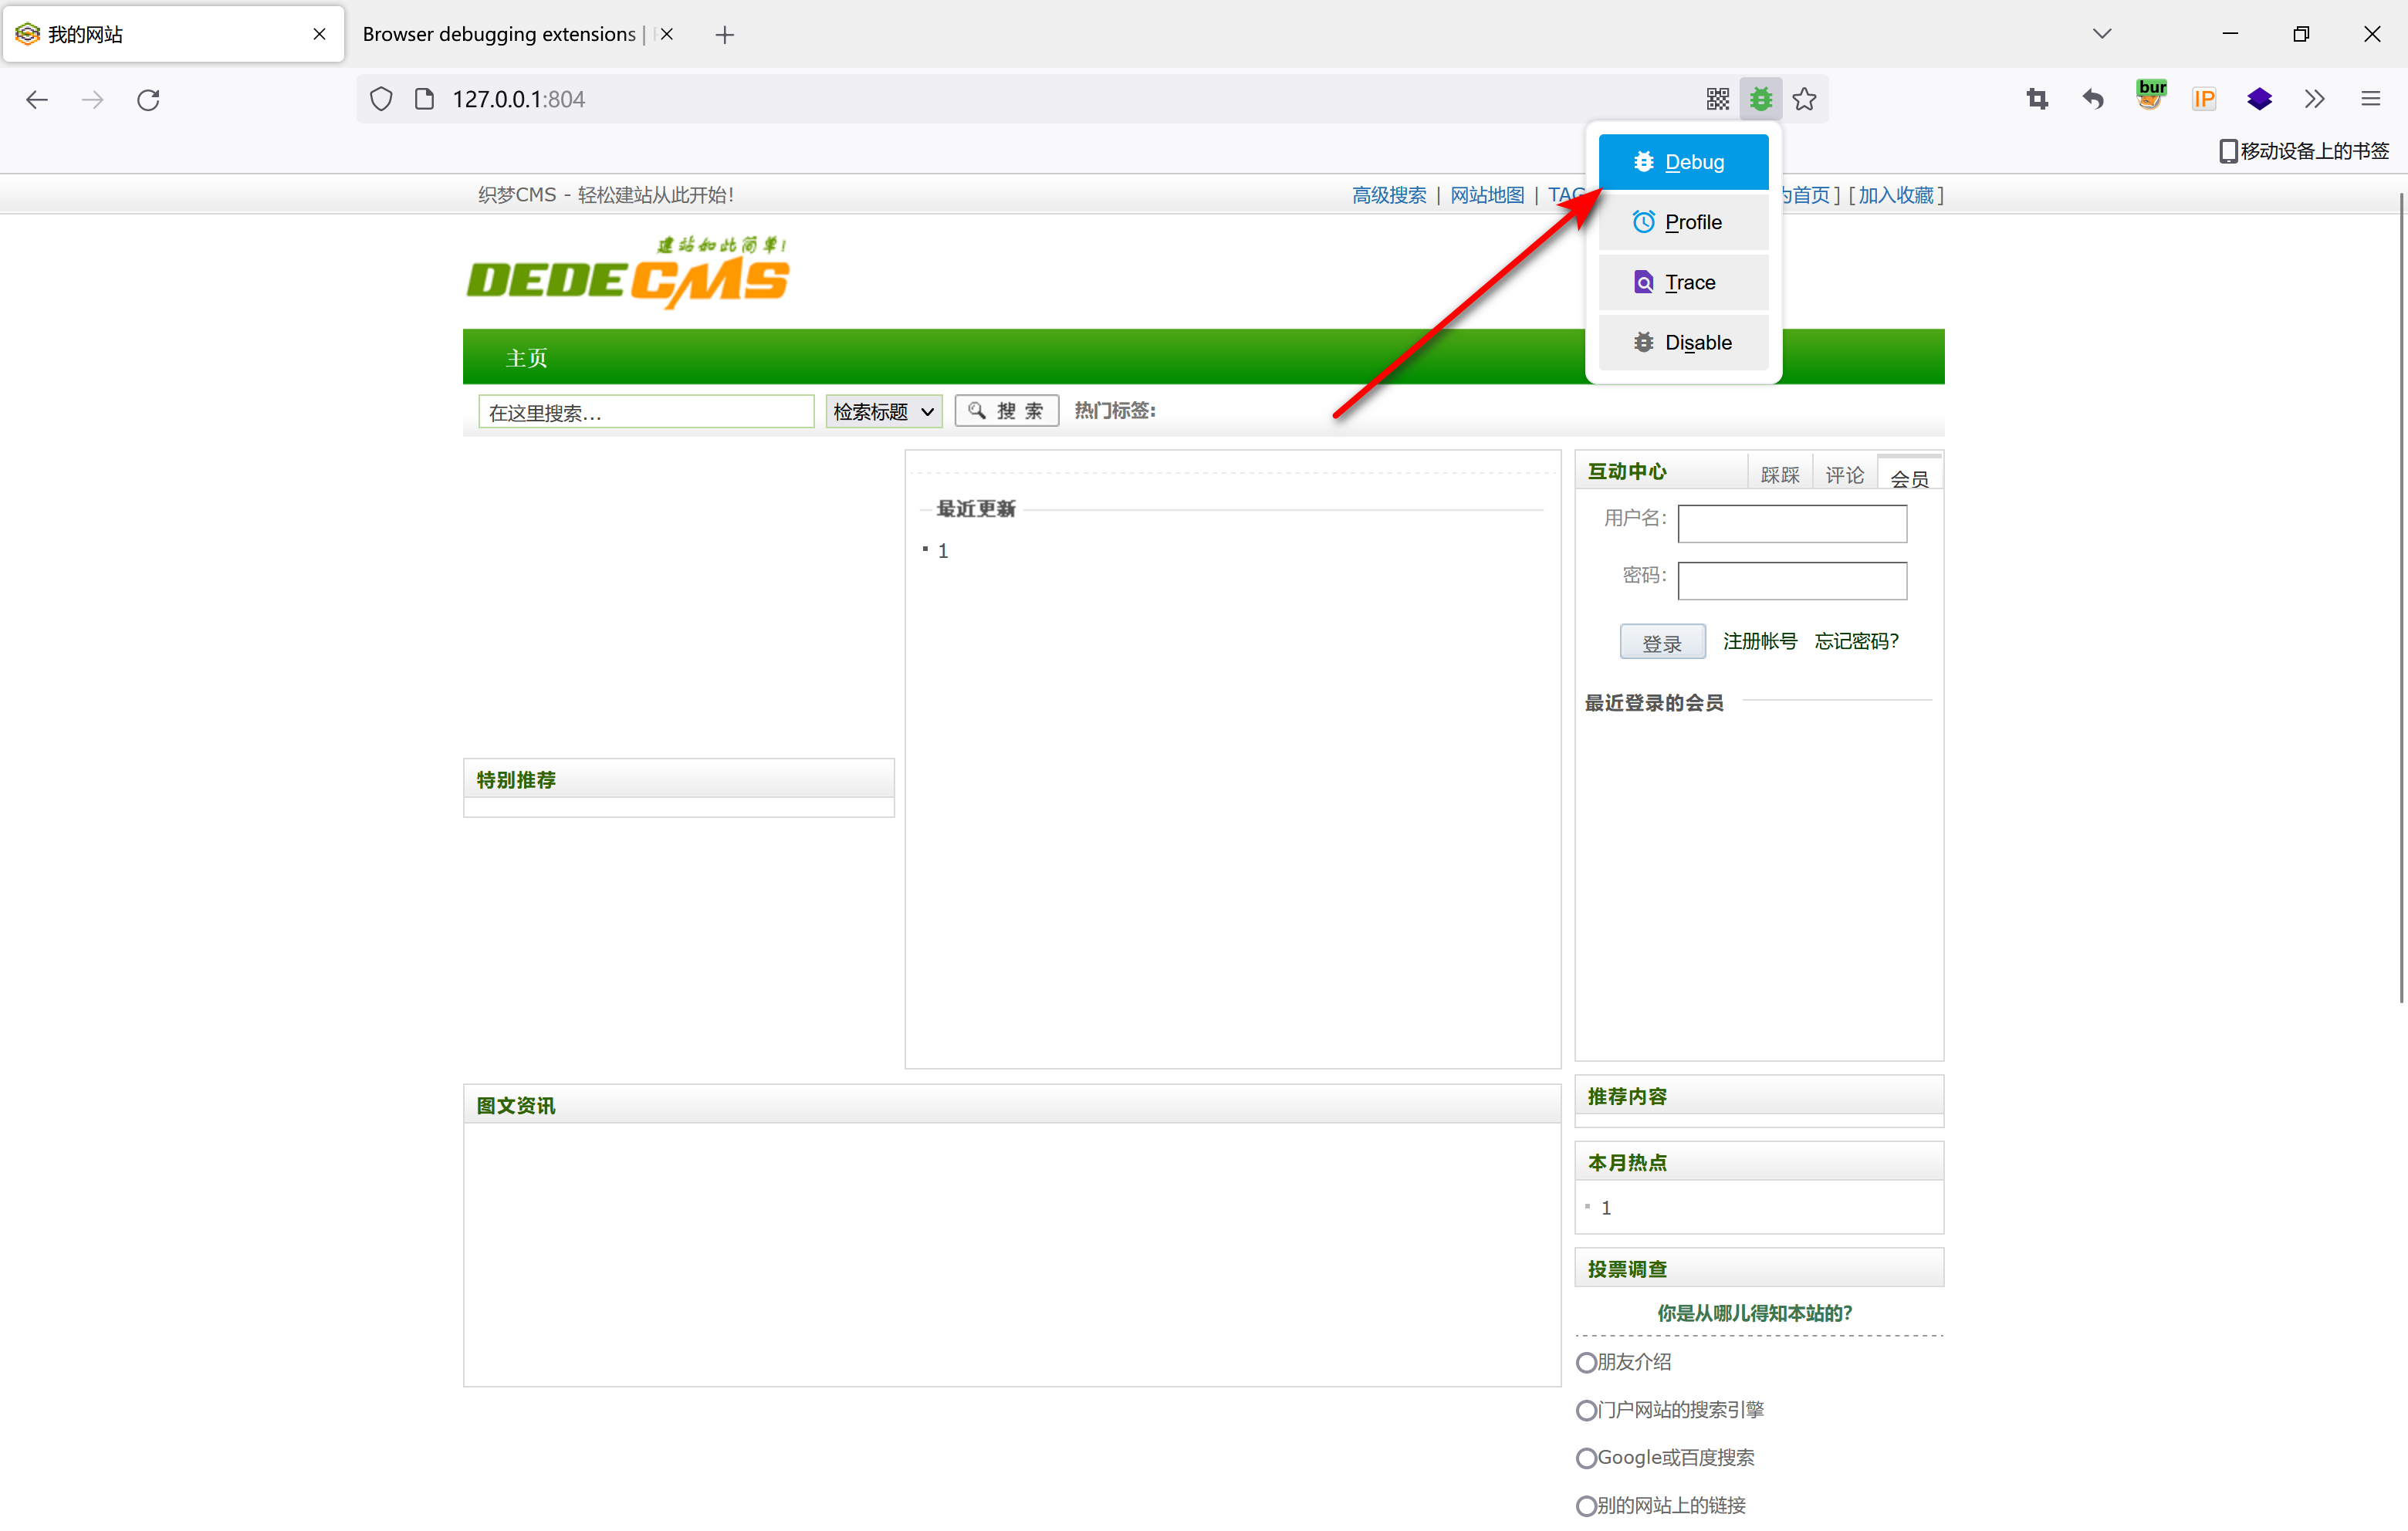 |
|---|
在主页下一个断点,并开启监听
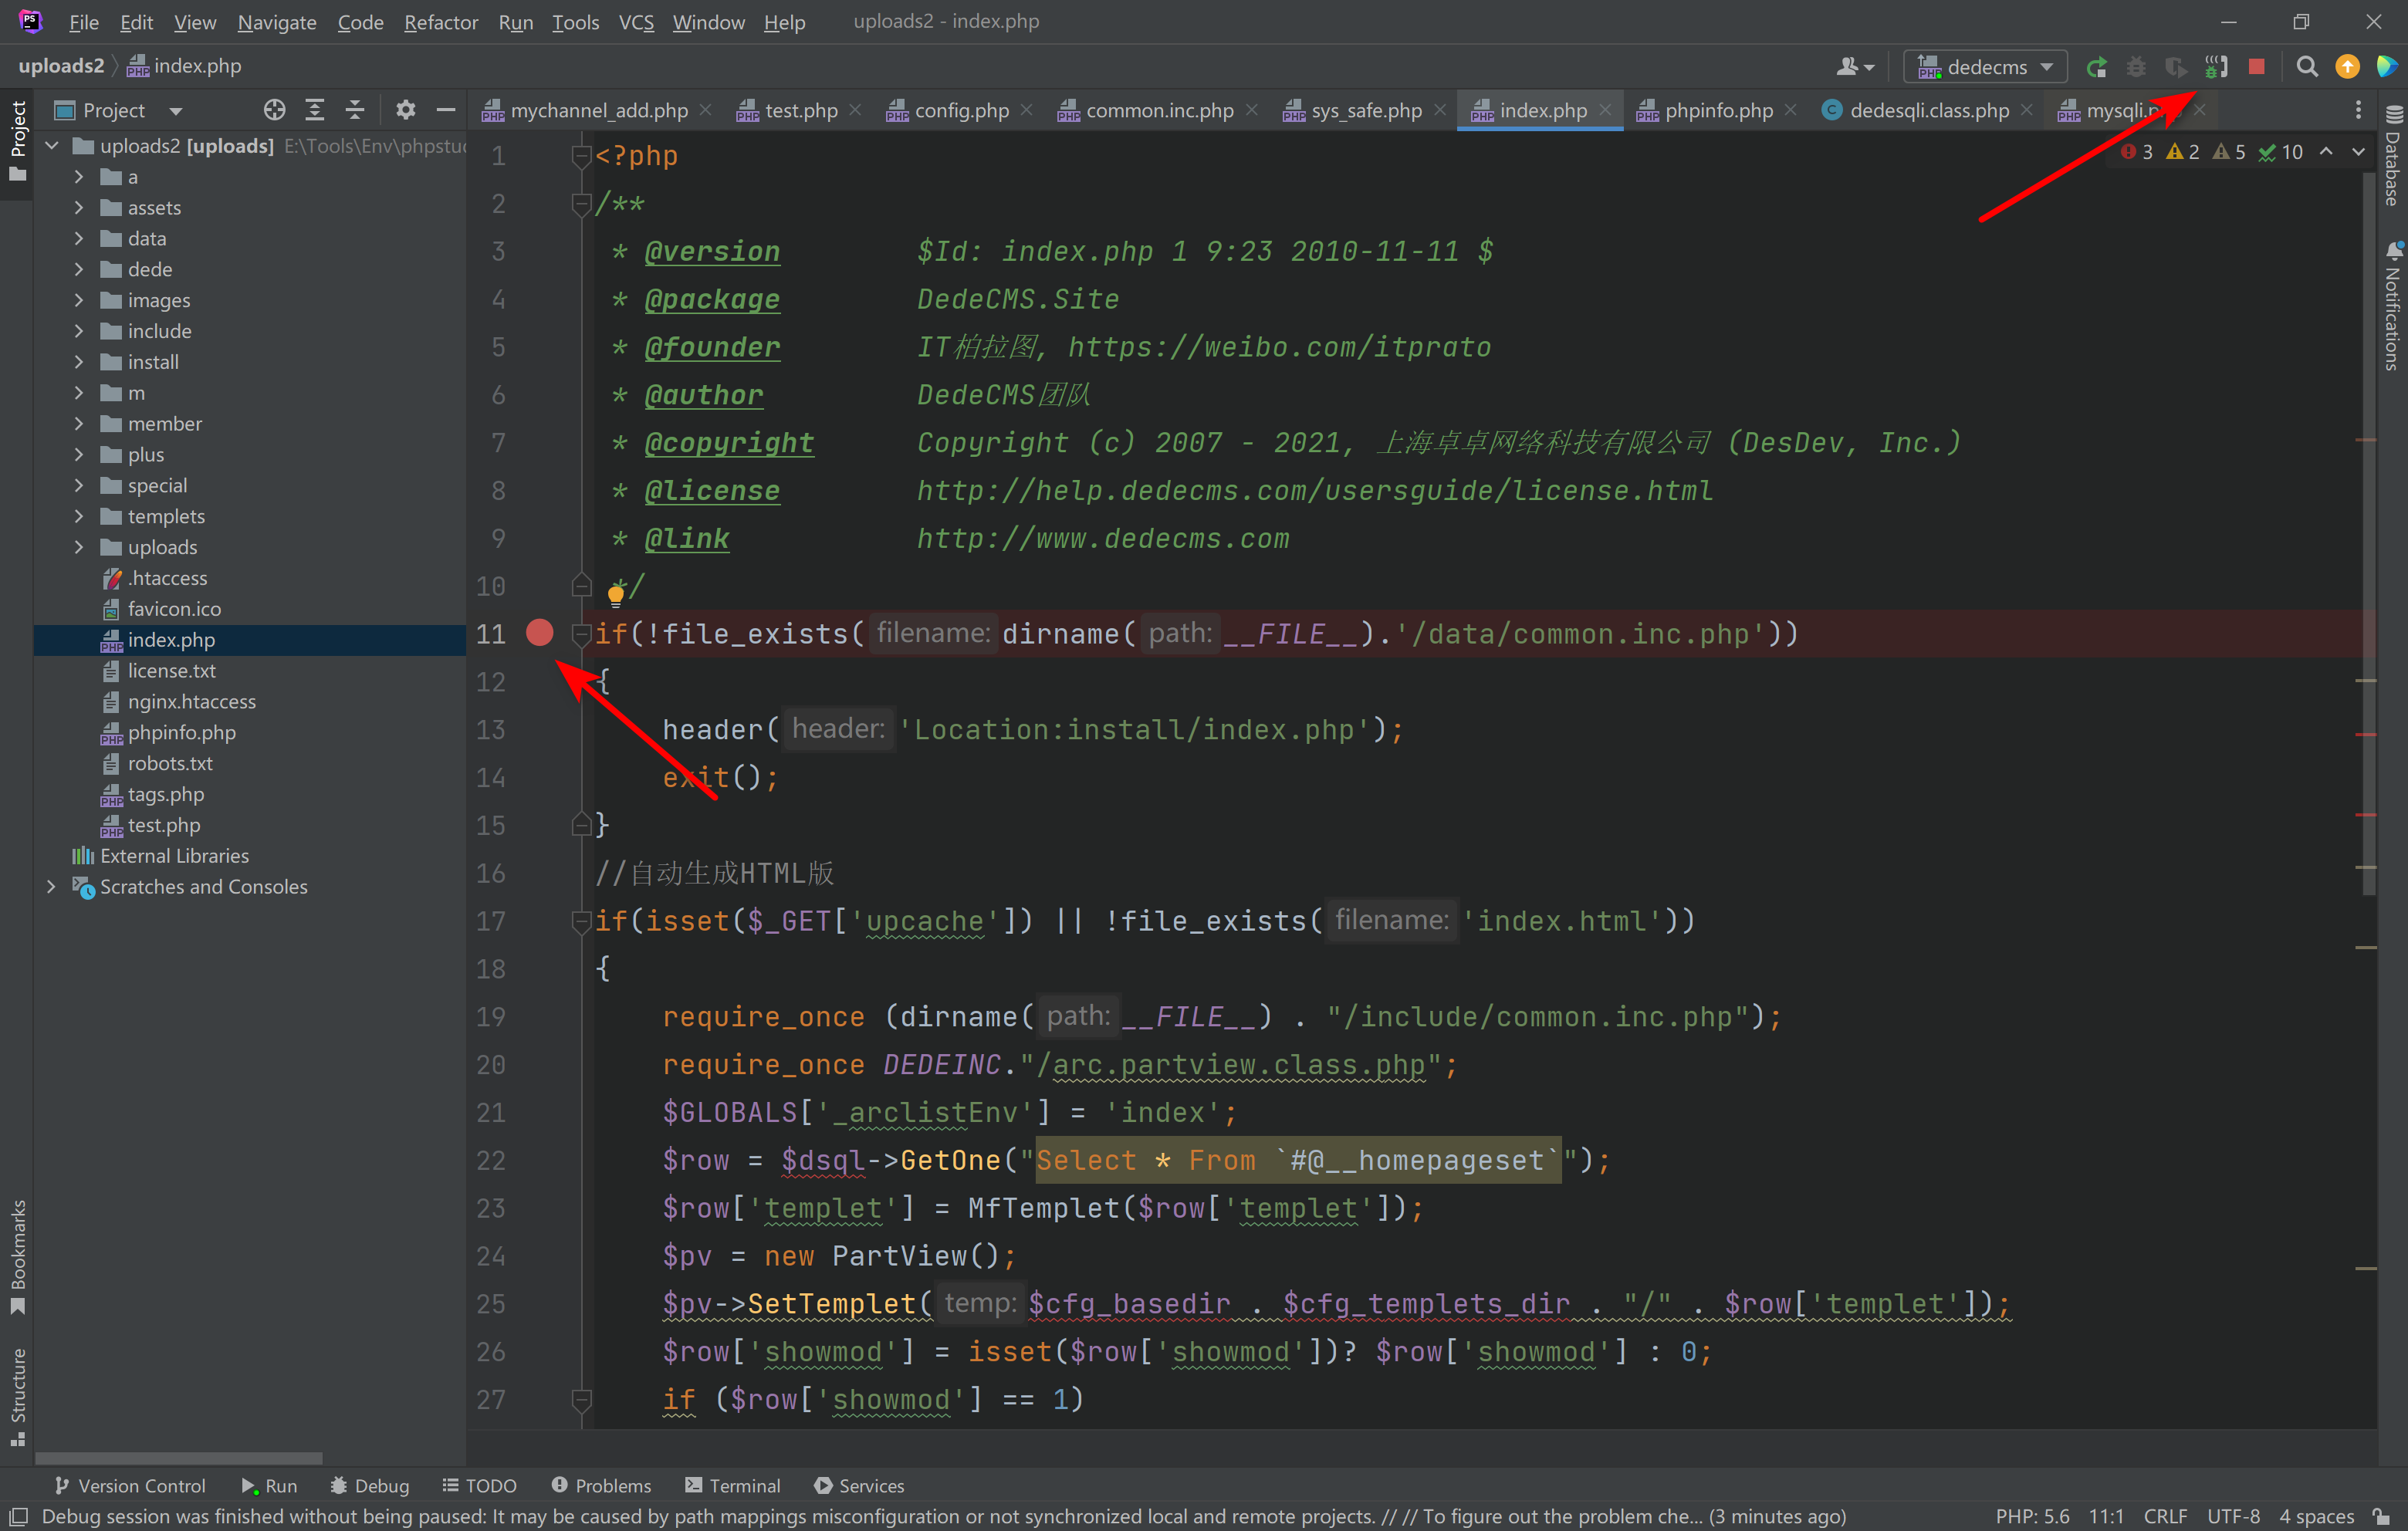 |
|---|
访问一下,成功拦截到
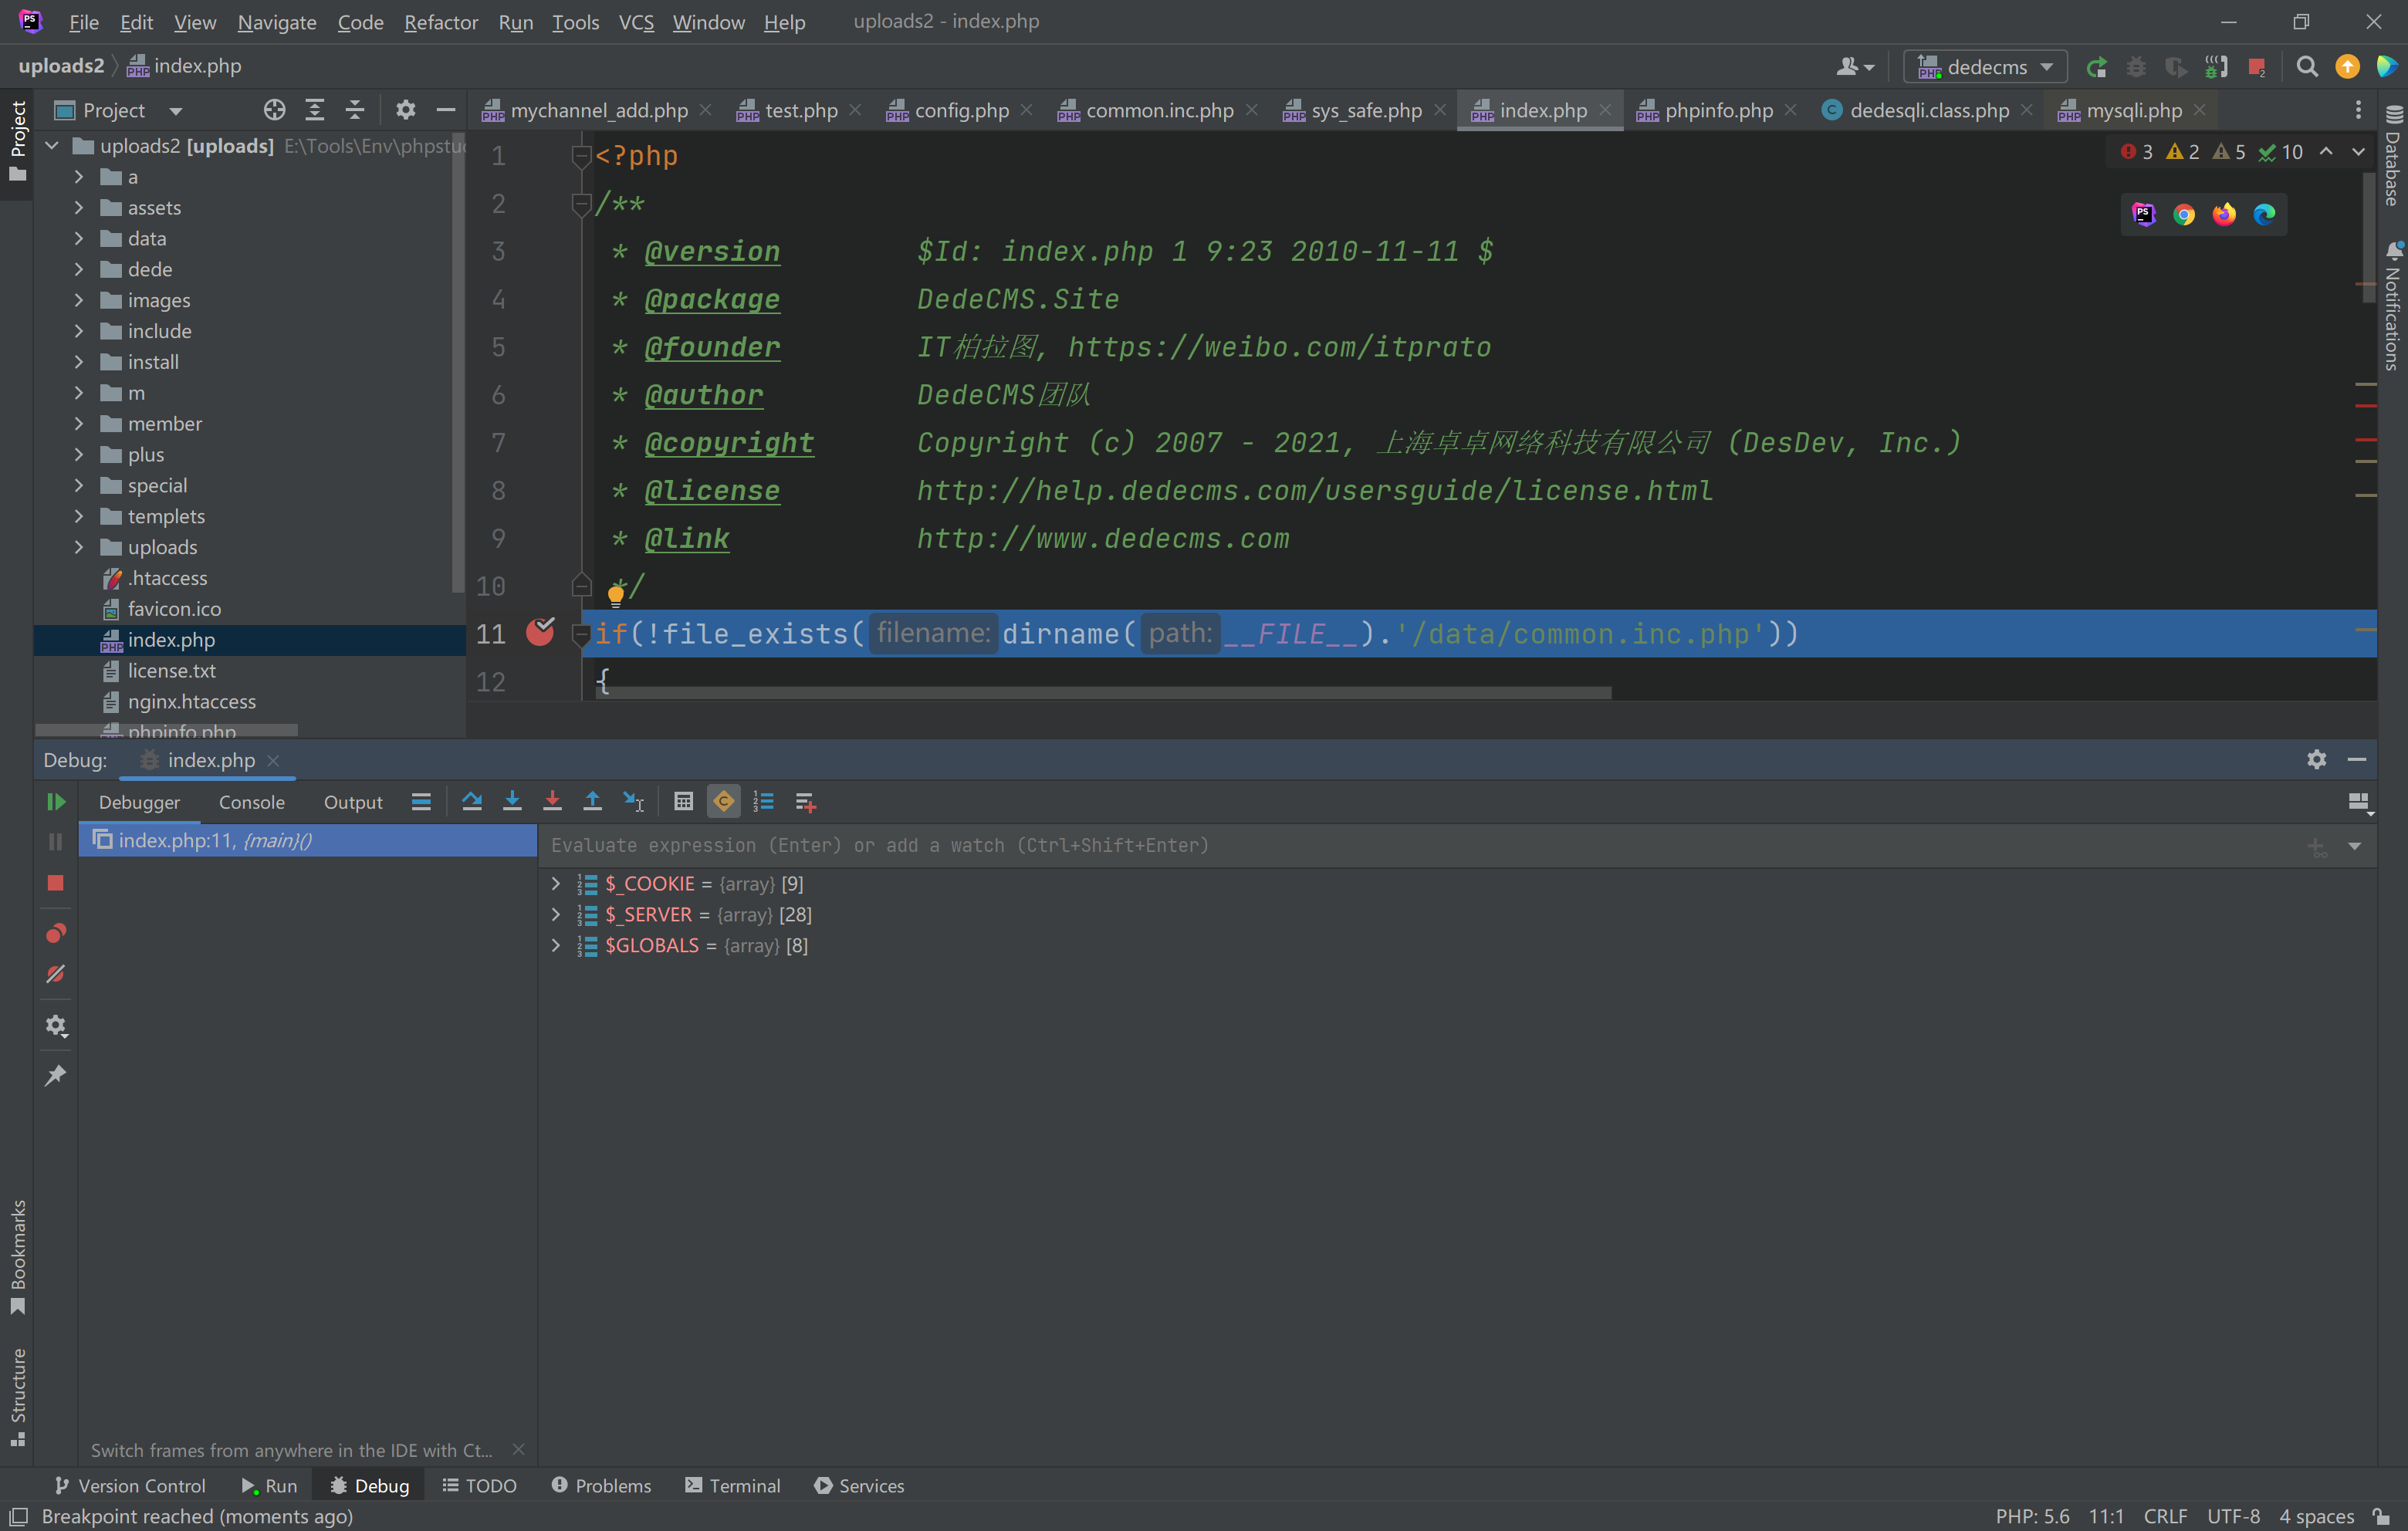 |
|---|